Six AI Labs Are Tied for the Frontier. The Price Gap Between Them Is Still 13x.
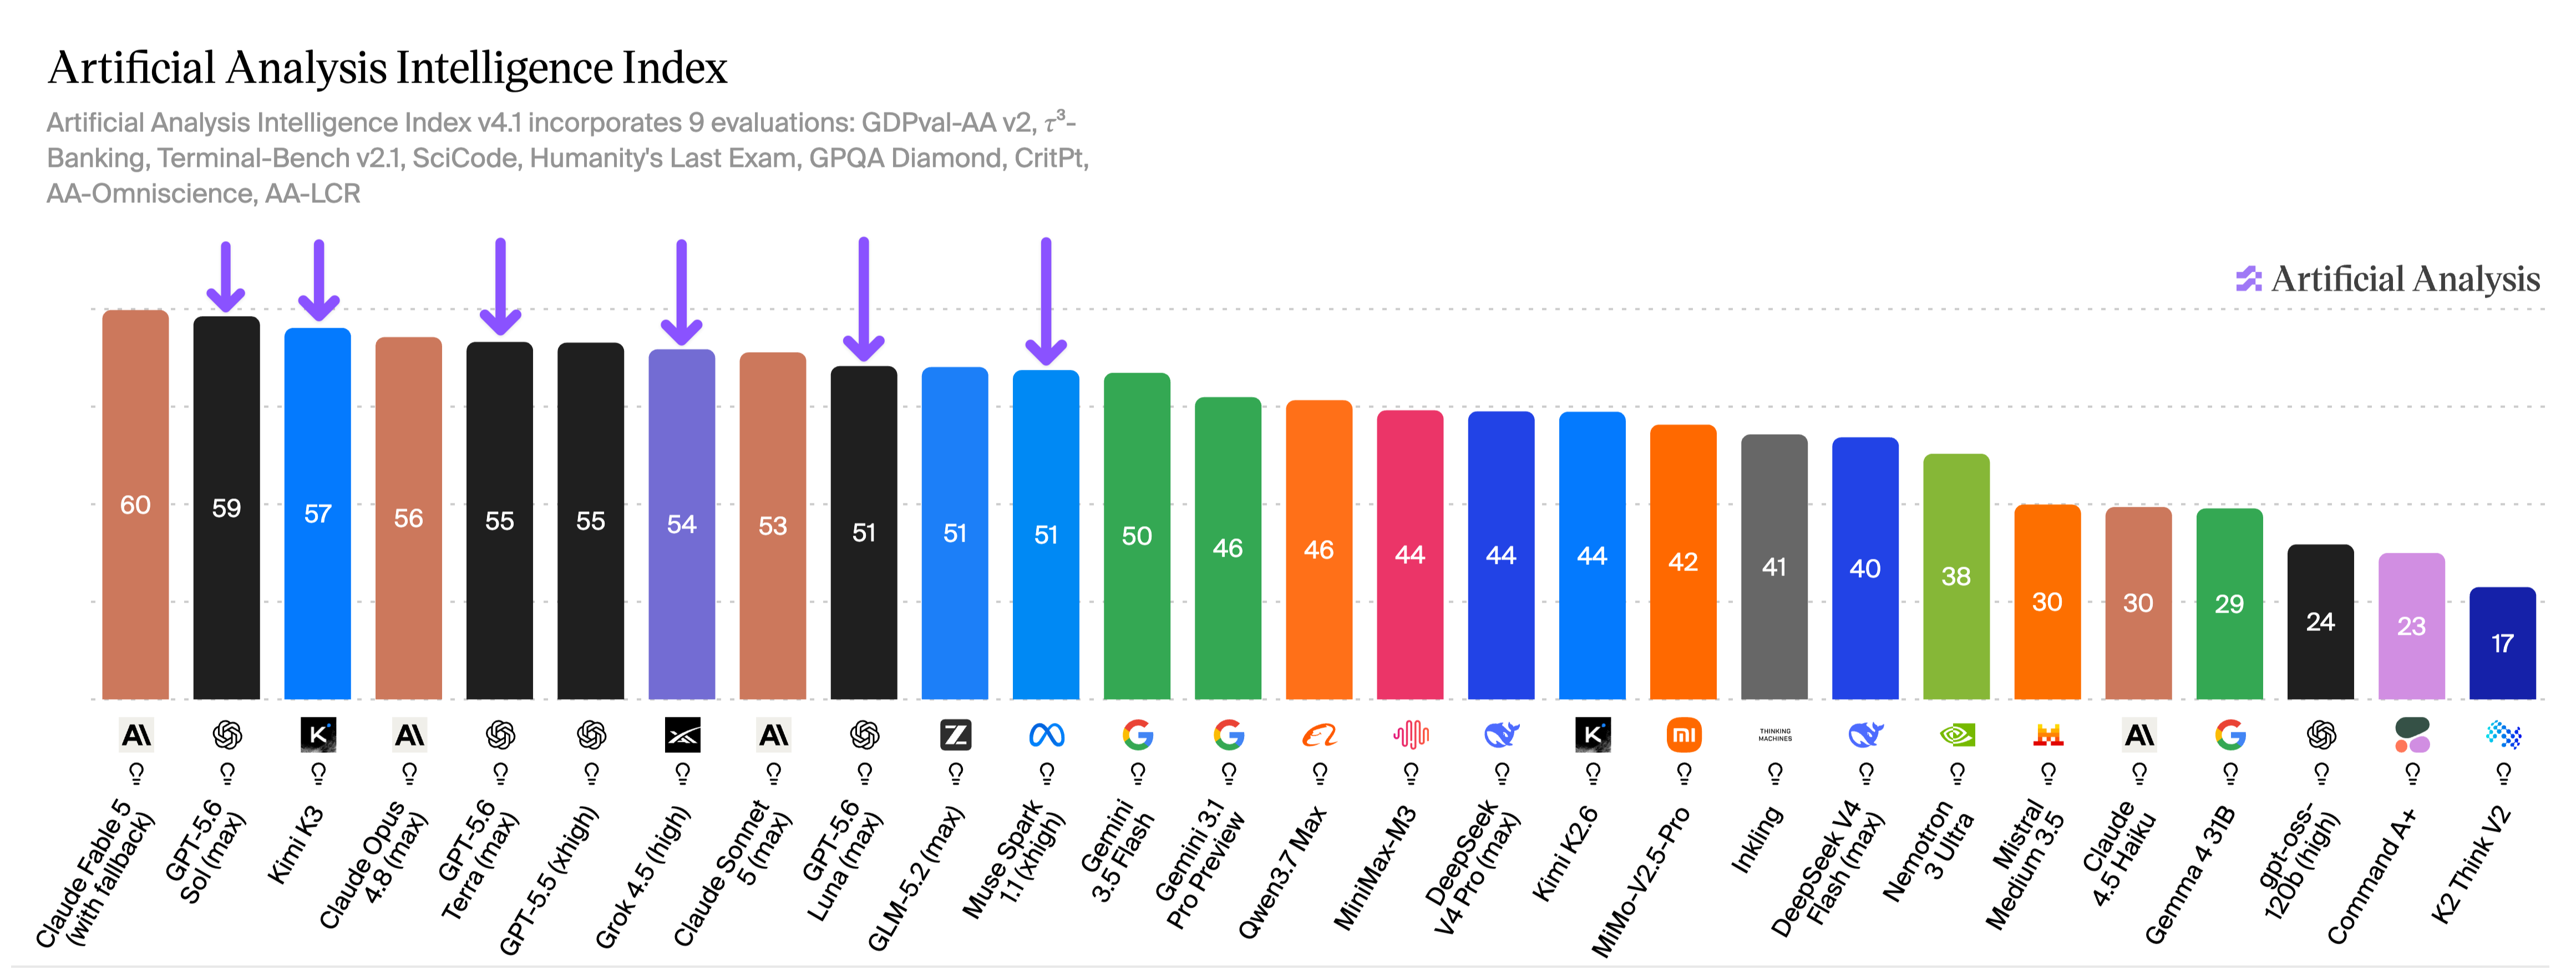
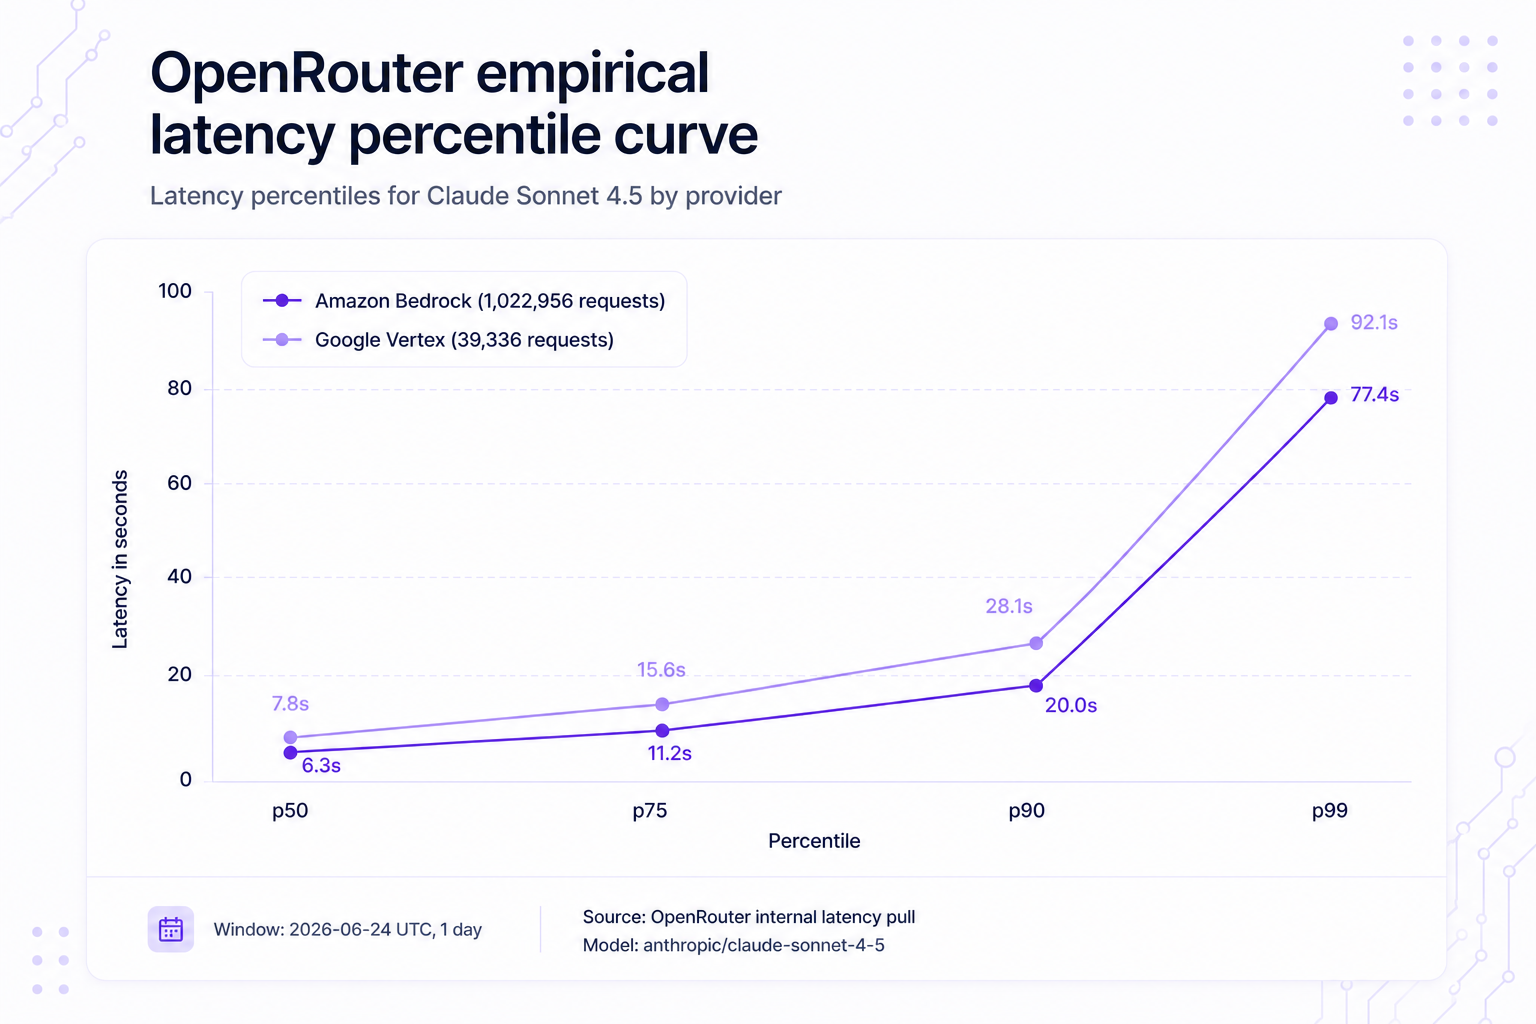
On July 17, 2026, Artificial Analysis published a chart with 11 bars on it. The highest scores 60. The lowest that still counts as frontier-grade scores 51. Six different labs, Anthropic, OpenAI, Moonshot, xAI, Meta, and Z AI, all sit inside that 9-point band. Cross-reference the same chart against pricing and the story flips: the cheapest model in that band costs 21 cents per completed task. The most expensive costs $2.75. Same tier, 13 times the bill. Eleven days later, OpenRouter published a second dataset that shows where the real gap actually lives now: the exact same model, run on 2 different clouds, with a worst-case response time that differs by 15 seconds depending only on which cloud served the request.
TL;DR
- 🏁 The tie — 6 labs (Anthropic, OpenAI, Moonshot, xAI, Meta, Z AI) now field a model above 50 on Artificial Analysis’s Intelligence Index v4.1, up from 2 labs in early June 2026. The whole top-11 field spans 51-60, a 9-point band.
- 💸 The price — GPT-5.6 Luna (score 51) costs $0.21/task. Claude Fable 5 (score 60) costs $2.75/task. 13x the price for 9 more points. At 1 million tasks a month, that’s $210,000 versus $2.75 million.
- 📅 The cadence — a new frontier-class model launched roughly every 2 days across Jul 1–22, 2026, per one industry tracker’s count.
- ☁️ The real test — OpenRouter measured Claude Sonnet 4.5 in production on Amazon Bedrock (1,022,956 requests) and Google Vertex (39,336 requests). p50: 6.3s vs 7.8s. p99: 77.4s vs 92.1s. Same weights, same model slug.
- 💰 The capital — Fireworks AI raised a $1.505B Series D (Jul 15, 2026) at a $17.5B valuation, serving 40 trillion tokens/day, over 95% from customer fine-tuned models. OpenRouter’s own weekly routed volume grew 5x in 6 months.
- 🧭 The takeaway — the model layer is commoditized to a 9-point rounding error. The infrastructure layer is where the actual variance, and the actual money, moved.
The chart that flattened the frontier
Artificial Analysis's Intelligence Index v4.1 scores models across 9 evaluations: GDPval-AA v2, τ³-Banking, Terminal-Bench v2.1, SciCode, Humanity's Last Exam, GPQA Diamond, CritPt, AA-Omniscience, and AA-LCR. It's a broad, blended score meant to summarize general frontier capability in one number. On July 17, 2026, Artificial Analysis published an update after 4 frontier launches in 8 days: Grok 4.5 (Jul 8), a 3-model GPT-5.6 trio, Sol, Terra, and Luna (~Jul 10), Muse Spark 1.1 (~Jul 10), and Kimi K3 (Jul 16). The result: 6 different labs now field a model scoring above 50, up from 2 in early June.
| Model | Score | Lab |
|---|---|---|
| Claude Fable 5 (with fallback) | 60 | Anthropic |
| GPT-5.6 Sol (max) | 59 | OpenAI |
| Kimi K3 | 57 | Moonshot AI |
| Claude Opus 4.8 (max) | 56 | Anthropic |
| GPT-5.6 Terra (max) | 55 | OpenAI |
| GPT-5.5 (max) | 55 | OpenAI |
| Grok 4.5 (high) | 54 | xAI |
| Claude Sonnet 5 (max) | 53 | Anthropic |
| GPT-5.6 Luna (max) | 51 | OpenAI |
| GLM-5.2 | 51 | Z AI |
| Muse Spark 1.1 (xhigh) | 51 | Meta |
Read that table as a single fact: the entire competitive frontier of AI, every lab that matters right now, fits inside 9 points. A year ago, a 9-point gap on a blended capability index was the difference between a model you'd ship and one you'd quietly stop using. In July 2026, it's the gap between 1st place and 11th.
2 labs to 6, in six weeks
The move that actually matters isn't any single score. It's the club size. In early June 2026, exactly 2 labs could field a model above the 50-point line on this index. By July 17, it was 6. Being frontier-grade, in the sense this index measures it, stopped being a rare, defensible position. It became table stakes that a majority of serious labs can now hit within weeks of each other.
Labs scoring above 50 on the Intelligence Index
Source: Artificial Analysis Intelligence Index v4.1 (Jul 17, 2026).
13x the price for 9 more points
Here’s where the story stops being about intelligence and starts being about money. GPT-5.6 Luna scores 51 and costs $0.21 per completed task. Claude Fable 5 scores 60, 9 points higher, and costs $2.75 per task. That’s 13x the price for a 15% higher score. Kimi K3 sits in between at a score of 57, for about half the price of Claude Opus 4.8, which scores 1 point lower. The cost curve and the capability curve have almost completely decoupled.
Cost per completed task vs. Intelligence Index score
Source: Artificial Analysis Intelligence Index, cost-vs-intelligence chart (Jul 17, 2026).
Run the math at production scale and the gap stops being abstract. 1 million completed tasks a month on GPT-5.6 Luna costs $210,000. The same 1 million tasks on Claude Fable 5 costs $2.75 million, for a model that scores 9 points, about 15%, higher on a blended benchmark. Whether that's worth 13x the spend depends entirely on whether your workload actually needs the marginal 15%, and for most production agent workloads, triaging tickets, routing tool calls, summarizing logs, it doesn't.
The uncomfortable question this table raises isn't “which model is smartest.” It's “why is anyone still defaulting to the most expensive option when the score gap has compressed to single digits.”
A new frontier model every 2 days
The field also won't hold still long enough to make a considered choice. Per one industry tracker's count, a new frontier-class model launched roughly every 2 days across the 3-week window from July 1 to July 22, 2026: poolside's Laguna XS 2.1/M.1 (Jul 2), Grok 4.5 (Jul 8), a Kwaipilot KAT-Coder V2.5 release (~Jul 10-11), the GPT-5.6 trio plus Muse Spark 1.1 (~Jul 10), Kimi K3 (Jul 16), Meituan's LongCat 2.0 (Jul 20), and Google's Gemini 3.6/3.5 pair alongside poolside's Laguna S 2.1 (Jul 21). By the time a team finishes benchmarking last week's leader against its own workload, that model usually isn't the leader anymore.
The real test: same model, 2 clouds
So set the model-picking question aside for a second and ask a narrower one: does the infrastructure serving a model matter as much as which model you picked? On July 28, 2026, OpenRouter published exactly the experiment to answer it. Not 2 different models. The identical model, anthropic/claude-sonnet-4-5, run through 2 different clouds, measured against real production traffic over a 1-day window (2026-06-24 UTC).
| Percentile | Amazon Bedrock | Google Vertex | Gap |
|---|---|---|---|
| p50 | 6.3s | 7.8s | +1.5s (+24%) |
| p75 | 11.2s | 15.6s | +4.4s (+39%) |
| p90 | 20.0s | 28.1s | +8.1s (+41%) |
| p99 | 77.4s | 92.1s | +14.7s (+19%) |
Bedrock's sample is 1,022,956 requests; Vertex's is 39,336, about 26x smaller, which means the Vertex tail estimate carries more noise than Bedrock's and shouldn't be read as precise to the decimal. But the direction holds across every percentile, and the median gap alone, 6.3s vs 7.8s on identical weights, is hard to explain any other way than the serving infrastructure itself. Same model. Same training. Same rough price. The only variable that changed was the cloud carrying the request, and it moved the worst-case wait time by nearly 20% at the tail.
Where the money actually went
Capital is already pricing this in. Fireworks AI, an inference and fine-tuning platform, raised a $1.505 billion Series D on July 15, 2026 at a $17.5 billion valuation, crossing $1B in annualized revenue (5x year over year) while serving 40 trillion tokens a day. Over 95% of that volume is customer-specialized, fine-tuned models, not off-the-shelf frontier names. OpenRouter, a model marketplace and router, raised a $113 million Series B at a $1.3 billion valuation in late May 2026, and its own weekly routed volume grew 5x in 6 months, from roughly 5 trillion to 25 trillion tokens a week.
Recent infra/gateway funding rounds
Sources: OpenRouter Series B announcement (May 26-28, 2026); Fireworks AI Series D announcement (Jul 15, 2026).
The 2 companies aren't directly comparable, Fireworks is primarily a direct-inference and fine-tuning platform for enterprises, OpenRouter is a marketplace and router, so their token-volume numbers shouldn't be plotted on the same axis. But the pattern behind both raises is the same: nobody wrote either check because the underlying model was smarter. They wrote it because the serving layer underneath models is now the thing that actually differentiates one AI product from another.
What didn't make the cut
A few numbers came up during reporting that didn't clear the bar to cite as fact, and they're worth naming instead of quietly dropping. A widely shared claim that Asia-origin models now account for 60% of OpenRouter's token volume, tripling since January, traces back to a Polymarket social post, not an OpenRouter-published figure. OpenRouter's own June 30, 2026 analysis of its token data says Chinese models “surpassed American ones in token share as of early June,” but it doesn't give a 60% number or a tripling claim at that precision. The direction is probably right; the specific figure isn't OpenRouter's. Similarly, the “one new frontier model every 2.2 days” framing used earlier in this post is a secondary aggregator's tally of individually verified launches, not a stat any single lab or index published. Each launch date checks out against multiple sources; the roll-up count is someone else's arithmetic, cited here as exactly that.
Auditing your own model and provider spend
The 2 numbers that matter for any team routing production traffic are the same 2 this post just walked through: dollars per intelligence point, and tail-latency spread across providers for the same model. Neither requires a benchmark lab, just your own pricing sheet and your own provider logs.
# model_provider_audit.py - cost-per-point and cross-provider latency spread
MODELS = [
    # name, intelligence_index_score, cost_per_task_usd
    ("GPT-5.6 Luna", 51, 0.21),
    ("Muse Spark 1.1", 51, 0.26),
    ("Grok 4.5", 54, 0.31),
    ("GLM-5.2", 51, 0.32),
    ("Kimi K3", 57, 0.94),
    ("GPT-5.6 Sol", 59, 1.04),
    ("Claude Opus 4.8", 56, 1.80),
    ("Claude Fable 5", 60, 2.75),
]

PROVIDER_LATENCY_P99 = {
    # provider: (p99_seconds, sample_size)
    "Amazon Bedrock": (77.4, 1_022_956),
    "Google Vertex": (92.1, 39_336),
}


def cost_per_point(name, score, cost):
    return {"model": name, "score": score, "cost_per_task": cost, "usd_per_point": round(cost / score, 4)}


def provider_spread(latencies):
    fastest = min(v[0] for v in latencies.values())
    return {
        provider: {
            "p99": p99,
            "samples": n,
            "pct_slower_than_fastest": round((p99 / fastest - 1) * 100, 1),
        }
        for provider, (p99, n) in latencies.items()
    }


for m in MODELS:
    print(cost_per_point(*m))

print()
for provider, stats in provider_spread(PROVIDER_LATENCY_P99).items():
    print(provider, stats)
$ python3 model_provider_audit.py
{'model': 'GPT-5.6 Luna', 'score': 51, 'cost_per_task': 0.21, 'usd_per_point': 0.0041}
{'model': 'Muse Spark 1.1', 'score': 51, 'cost_per_task': 0.26, 'usd_per_point': 0.0051}
{'model': 'Grok 4.5', 'score': 54, 'cost_per_task': 0.31, 'usd_per_point': 0.0057}
{'model': 'GLM-5.2', 'score': 51, 'cost_per_task': 0.32, 'usd_per_point': 0.0063}
{'model': 'Kimi K3', 'score': 57, 'cost_per_task': 0.94, 'usd_per_point': 0.0165}
{'model': 'GPT-5.6 Sol', 'score': 59, 'cost_per_task': 1.04, 'usd_per_point': 0.0176}
{'model': 'Claude Opus 4.8', 'score': 56, 'cost_per_task': 1.8, 'usd_per_point': 0.0321}
{'model': 'Claude Fable 5', 'score': 60, 'cost_per_task': 2.75, 'usd_per_point': 0.0458}
Amazon Bedrock {'p99': 77.4, 'samples': 1022956, 'pct_slower_than_fastest': 0.0}
Google Vertex {'p99': 92.1, 'samples': 39336, 'pct_slower_than_fastest': 19.0}Sorted by usd_per_point, GPT-5.6 Luna is roughly 11x more cost-efficient per Intelligence Index point than Claude Fable 5. That doesn't mean Luna is the right choice for every task, some tasks genuinely need the marginal 9 points, but it does mean the choice should be made on that basis explicitly, not on leaderboard rank alone. And the provider-spread half of the script is the check most teams never run at all: the same model slug, through a different provider, can cost you nearly 20% more wall-clock time at the tail for identical output.
If you want to build your own always-on version of this
Re-running this audit by hand, against every new model launch and every provider update, on top of everything else an infra or platform team already tracks, is exactly the kind of job that shouldn’t depend on someone remembering to re-check a pricing page. A mhermes agent, running 24/7 on its own isolated VM, can pull fresh Intelligence Index and provider-latency data on a schedule, re-run the audit script above, and page you the moment a cheaper model closes the gap on your current default, or a provider’s tail latency drifts past what your SLA allows.
And once you know which model and which provider actually wins on your own numbers, MegaBrain gives you one API across 500+ models with transparent, at-cost pricing, so switching from Claude Fable 5 to GPT-5.6 Luna, or from one cloud’s Claude Sonnet 4.5 endpoint to another’s is a one-line config change, not a new integration.
MegaBrain Gateway
500+ models. One API. No markup.
Use in Claude Code, Cline, Cursor, or any coding agent.
Newsletter
Stay in the loop
Get the latest model comparisons and guides — no spam, unsubscribe anytime.